
Reimagining news for the web (Part 2)
This post is the second in a two part series that talks about how traditional news companies can reimagine media for the web. The first post outlined 4 areas in which media companies are currently not doing enough. This post suggests solutions to the aforementioned problems. It is somewhat self-promotional, as I use my own work to illustrate the point.
1 - Use Data Science to personalize offerings to users: There is a wealth of information that users share with a provider when they visit a site. This includes their IP-address (which can be used to find out their current city), referrer-data (which tells a publisher where a user came from), device data (browser, OS, device type and the like). At the same time, their past browsing history on a site can be tracked and managed with cookies. Yet, publishers typically treat all users the same.
Imagine that you are a shop-owner, and you have a customer who always buys apples from you. But apples are stocked all the way at the back of your shop. The customer tries to be loyal for a while, but eventually decides to go to another shop where apples are stocked right at the front and he won't have to waste time navigating to them.
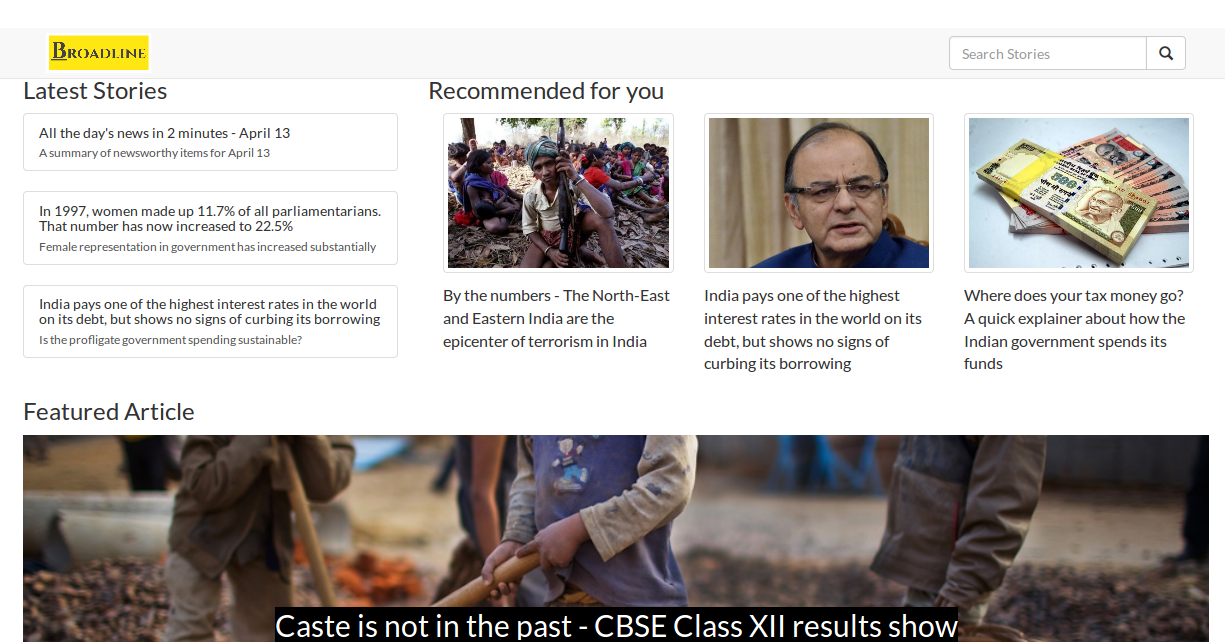
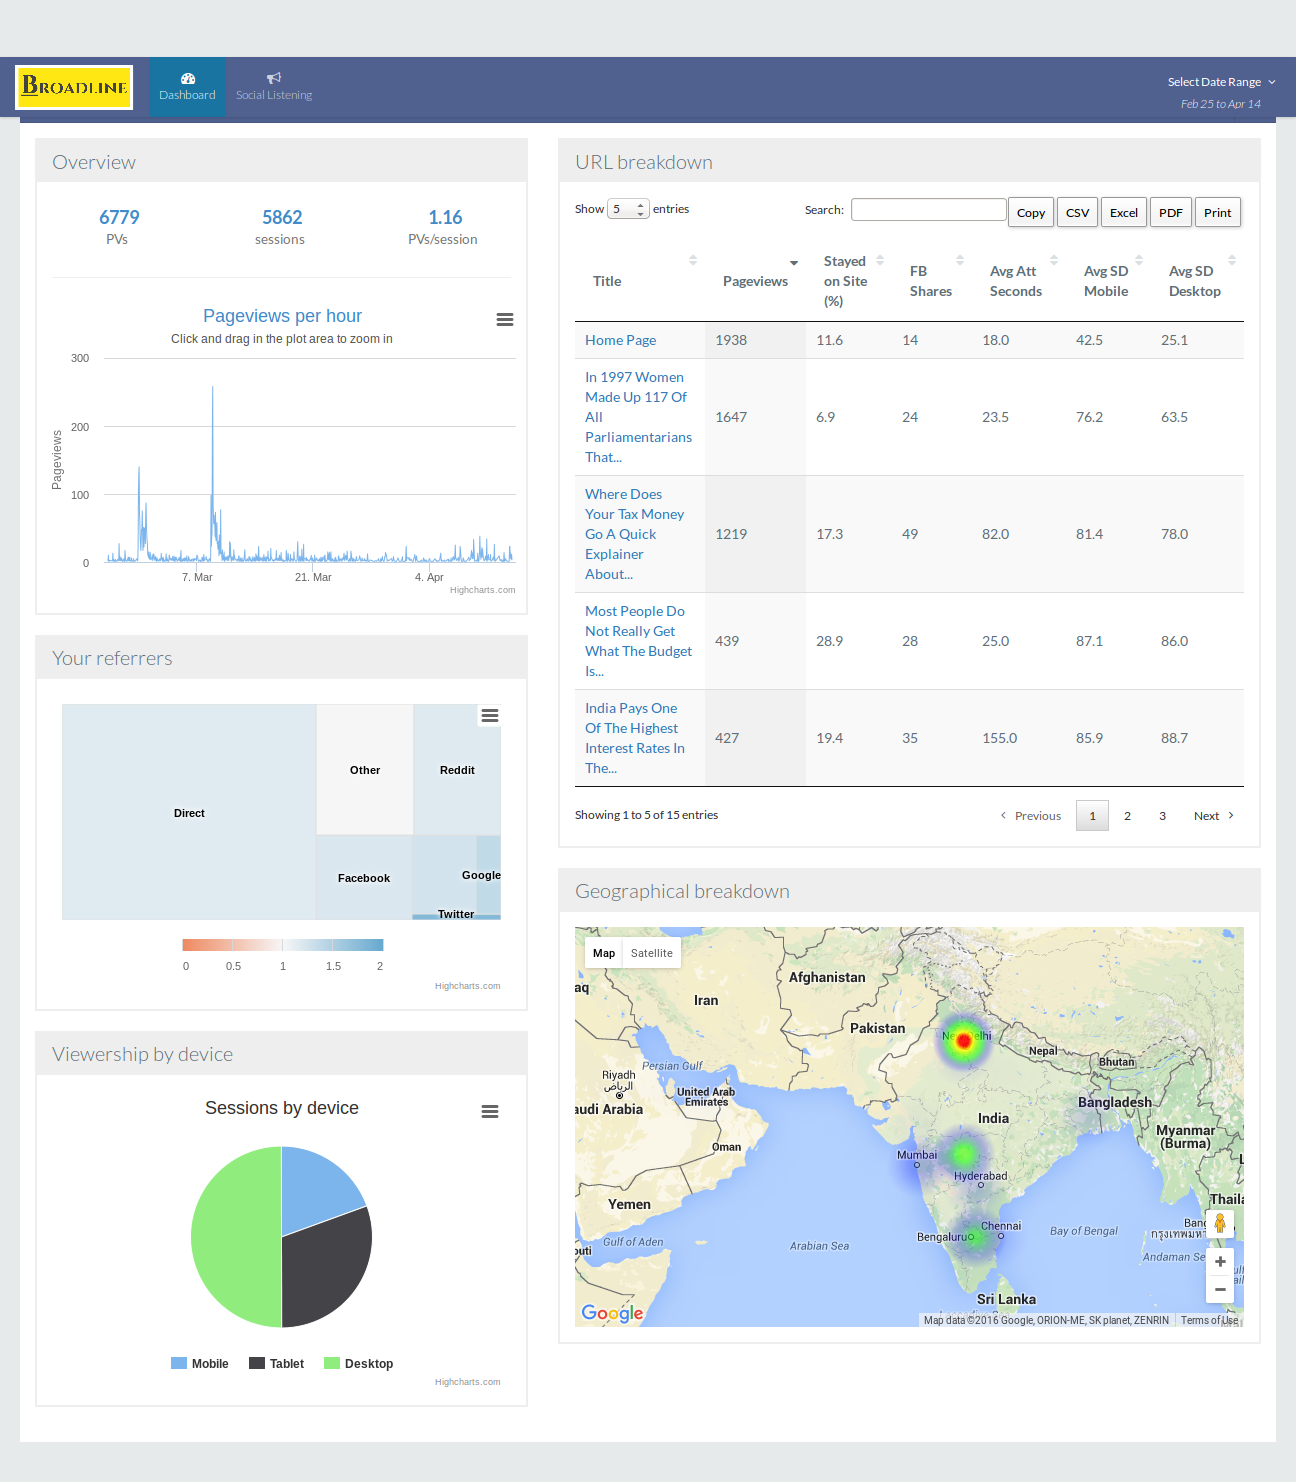
This analogy is not all that inaccurate for general news publishers that are beginning to lose users to niche sites. Thankfully, Data Science offers a solution. I have implemented a personalized article recommendation system on my site, TheBroadline.com. Users are shown articles based on where they live, where they entered the site from, and past articles (if any, that they have seen on the site). For instance, a user living in India who has visited the site for the first time would see the following:
On the contrary, a non-Indian user would see the following:
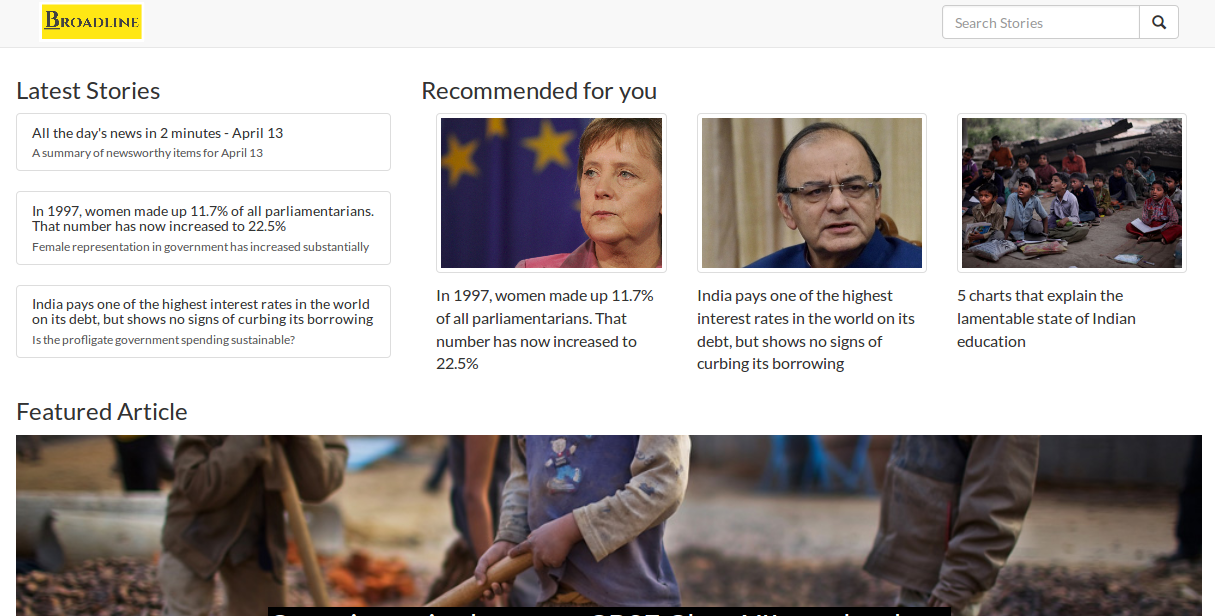
Notice how the first recommended article is the only one on my site that is not about India. This is automatically determined by algorithms that run round the clock. They look at what users similar to a given user has seen, and recommend articles that a given user might like. I have configured the algorithm to work on a country level (since I have a very limited audience and few articles right now), but you can make it work at a city or regional level as well.
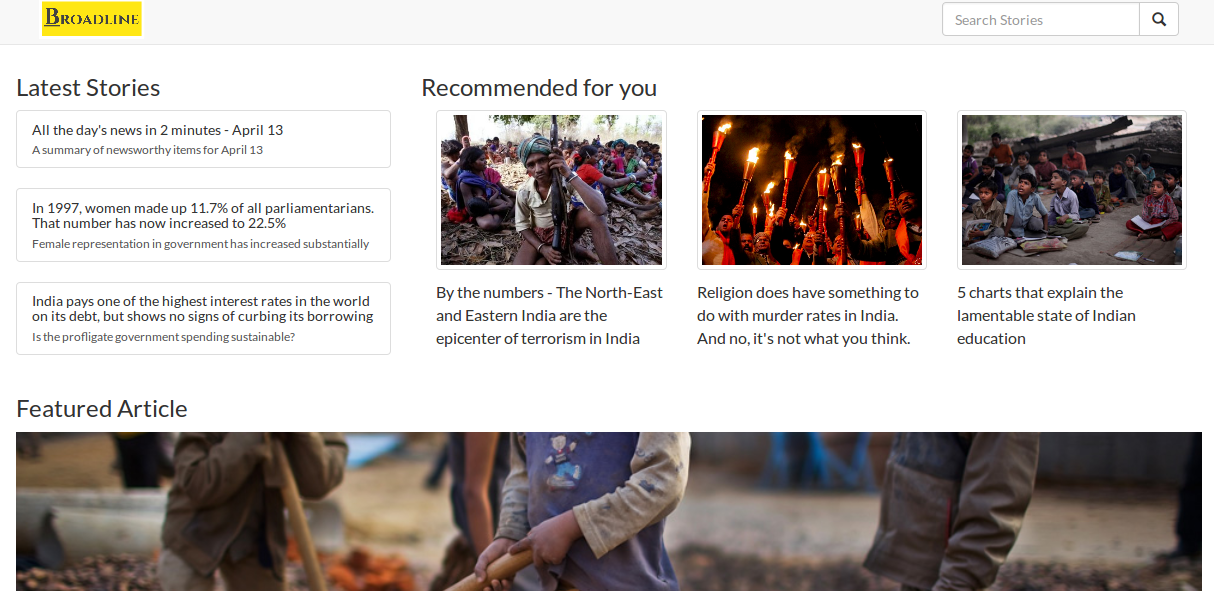
Moreover, if the user has been on the site before, we can hazard a guess at what kind of content she would like. You can use algorithms to then recommend content completely tailored to this user. For instance, after I visited articles about the role of caste in education in India, and an increase in communal violence in India, the algorithm automatically recommended these articles the next time I visited the home page:
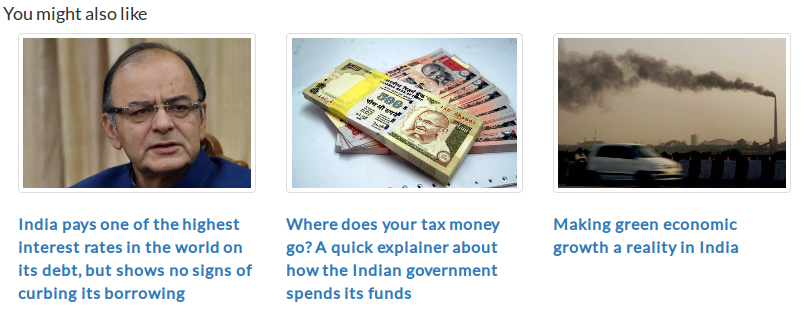
These recommendations can also be used to show new pieces to a user after he finishes reading an article. This helps significantly with both engagement and retention. For instance, this is what a user sees after viewing an article about the Indian Budget.
I have found that these recommendations have helped increase my site's pageviews per session by 16%. My site has very little traffic, so the lift doesn't really make a big difference in absolute terms. But it can make a huge different for larger sites. If you are wondering how exactly I measured the increase due to these recommendations, read on!
2 - Measure everything, and use A/B testing to find out what works better: Most traditional sites use Google Analytics to track the what is working on their site. Often, they also use tools like Comscore, ChartBeat and Effective Measures to understand their target audience better, and to see what kind of users respond best to what kind of content. These are great tools, and deliver huge value to companies. But they seem to built more for ad-sales teams than content teams. I found Parsely extremely effective at content-based analytics, but did not find many other solutions that tell editors what they should write about.
In response to this, I built my own analytics tools. Apart from simply measuring pageviews, I measured the 'active time' (i.e., time spent scrolling or otherwise actually interacting with content) that users spend on a page. I also measured the social shares that an article got over time, as well the depth to which users scrolled. I overlayed this information with where users came from, and how they behaved on the site to get a clear and succinct picture of how my users behaved. Using the dashboard, I can also get more detailed information about an individual link, device type, referrer, or geographical area.
I combined these analytics with A/B testing. An algorithm split users into groups randomly, and showed them different versions of the home page and the story page. This is currently being used to find out what designs work best to retain users. For instance, if you visit this page right now, you might see either of 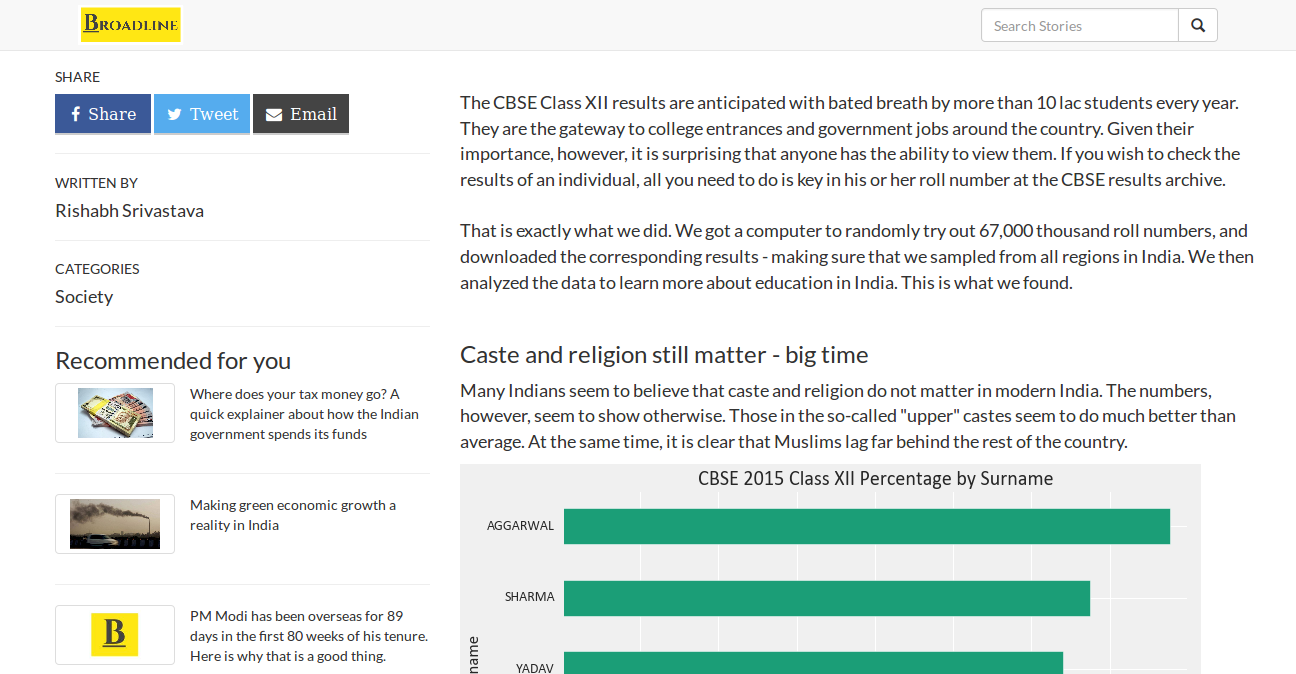 , or
, or 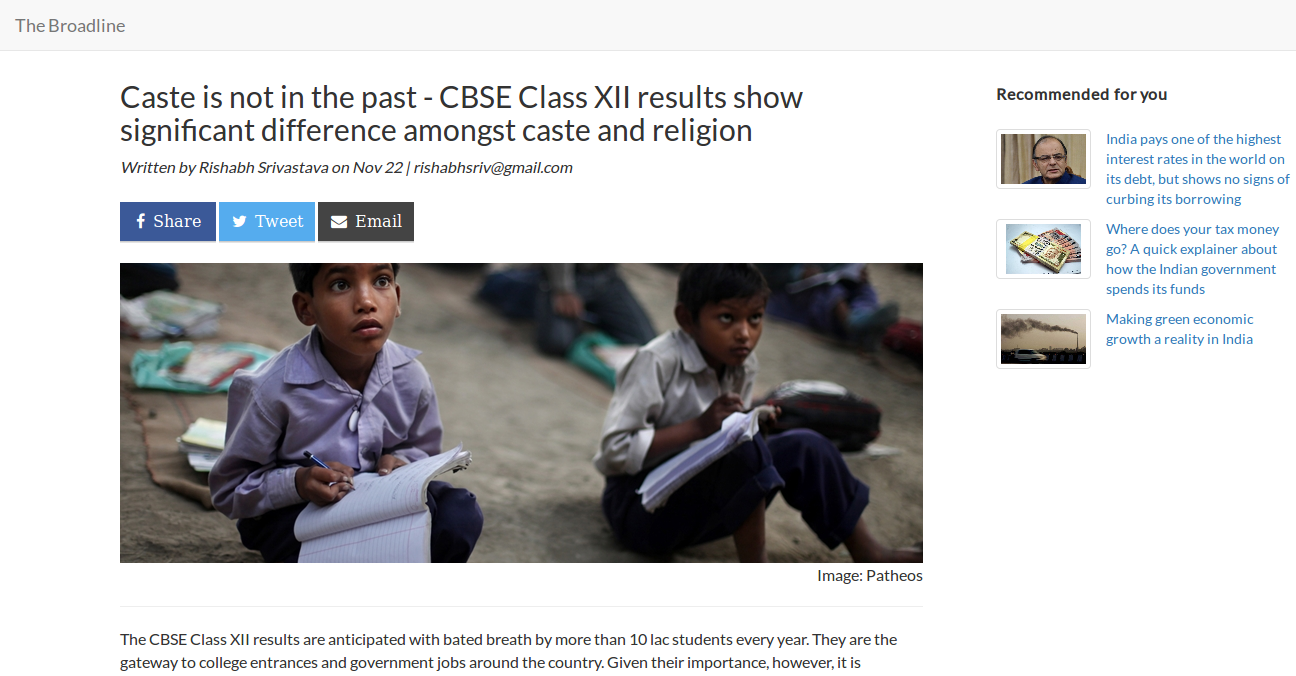 . After gather enough data points, I will be able to see which design is better at retaining users.
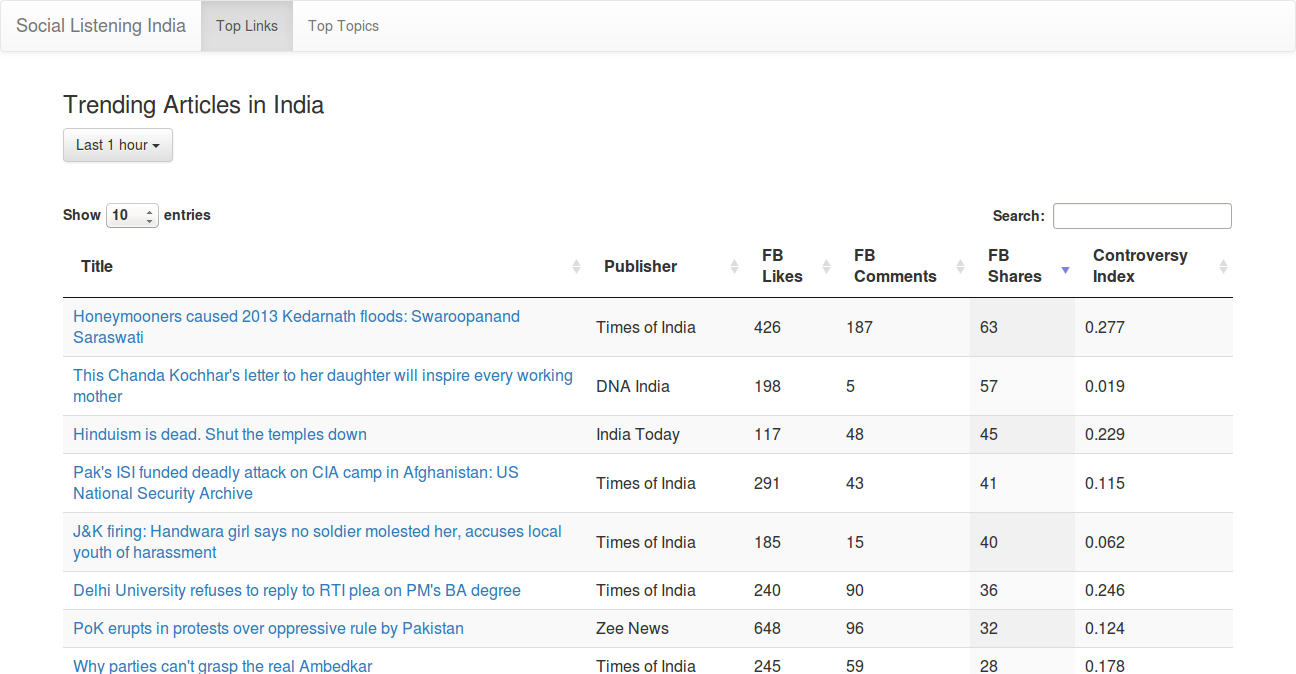
Additionally, we can use social listening tools to find out what is popular at a given moment. For instance, I built a tool to see what is popular in India at any given time.
Using experiments and by measuring what's important, traditional media companies can significantly improve their sites and optimize them for the best results.
3 - Give users interactives to play with: The web allows stories to go from author-driven narratives to exploratory journeys where readers can make sophisticated conclusions for themselves. Many western companies - like The New York Times, BuzzFeed and FiveThirtyEight - have realized this, and often use interactives for their biggest stories. Unfortunately, this is not yet true for Asia. Interactives are hard to pull off, because they take up a substantial amount of time to make and are hard to standardize across devices. When they come off, however, the results can be very pleasing. Take a look at this article about the impact of caste in Indian education results for an example.
4 - Using technology to automate research and analysis for journalists: Journalists currently have to do a lot of research from scratch when they do an analysis or opinion piece. To make sure that they journalists spend more time on crafting stories and less time on mind-numbing research, companies should invest in tools that automate analysis and research. As an example, below are screenshots of some research and analysis apps that I created for a large Indian newspaper.
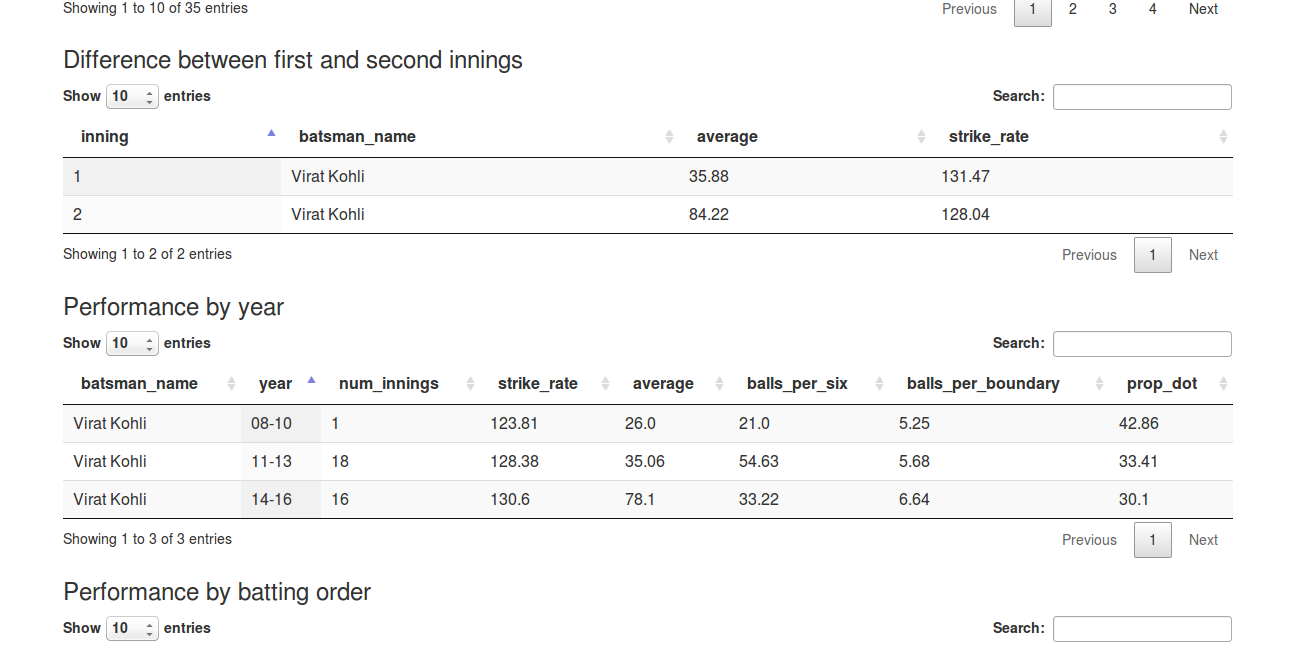
Cricket Analytics for the T20 World Cup
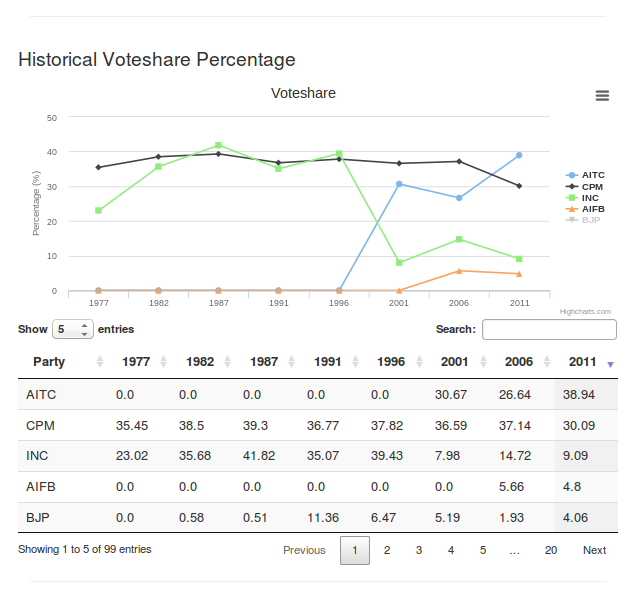
Election Analytics for Indian Elections
Both these apps helped journalists reduce the time taken to do research significantly, and they could spend more time on conceptualizing awesome graphics and narrating a great story. A similar investment in other areas could yield significant dividends for traditional media companies.